
Reporting for every sale, market and season
See revenue, tickets and orders in one overview, map every sale as hex density, compare sales with ZIP code population, and set every night against past seasons.
See revenue, tickets and orders in one overview
Net revenue, fees, net tickets, orders, average order and refunds for any event and period, with daily sales underneath.
Each order lands in a hexagon on the map, colored by orders, tickets or revenue.
Click or drag across hexagons to select them, then name the zone and save it.
Each saved zone reports its own totals and lists its orders.
Compare sales with ZIP code population, rolled up to city and state
Tickets are measured against each ZIP code's population, so a small town with strong turnout stands out beside a larger city.
See how many customers came back
Each event shows its repeat and new customers, tickets and revenue, by event date and ticket type.
Compare every night with the same weekday in past seasons
The seasonal calendar shows each night's tickets and revenue beside the matching night of the year you choose.
Import past sales from your previous ticketing platform
Upload a CSV export and map its columns, and earlier seasons appear in your calendar, forecast and repeat customer reports.
Forecast every night from this year's pace and last year's sales
Each upcoming night gets a projected total beside last year's, and a switch shows revenue with your dynamic pricing rules applied.
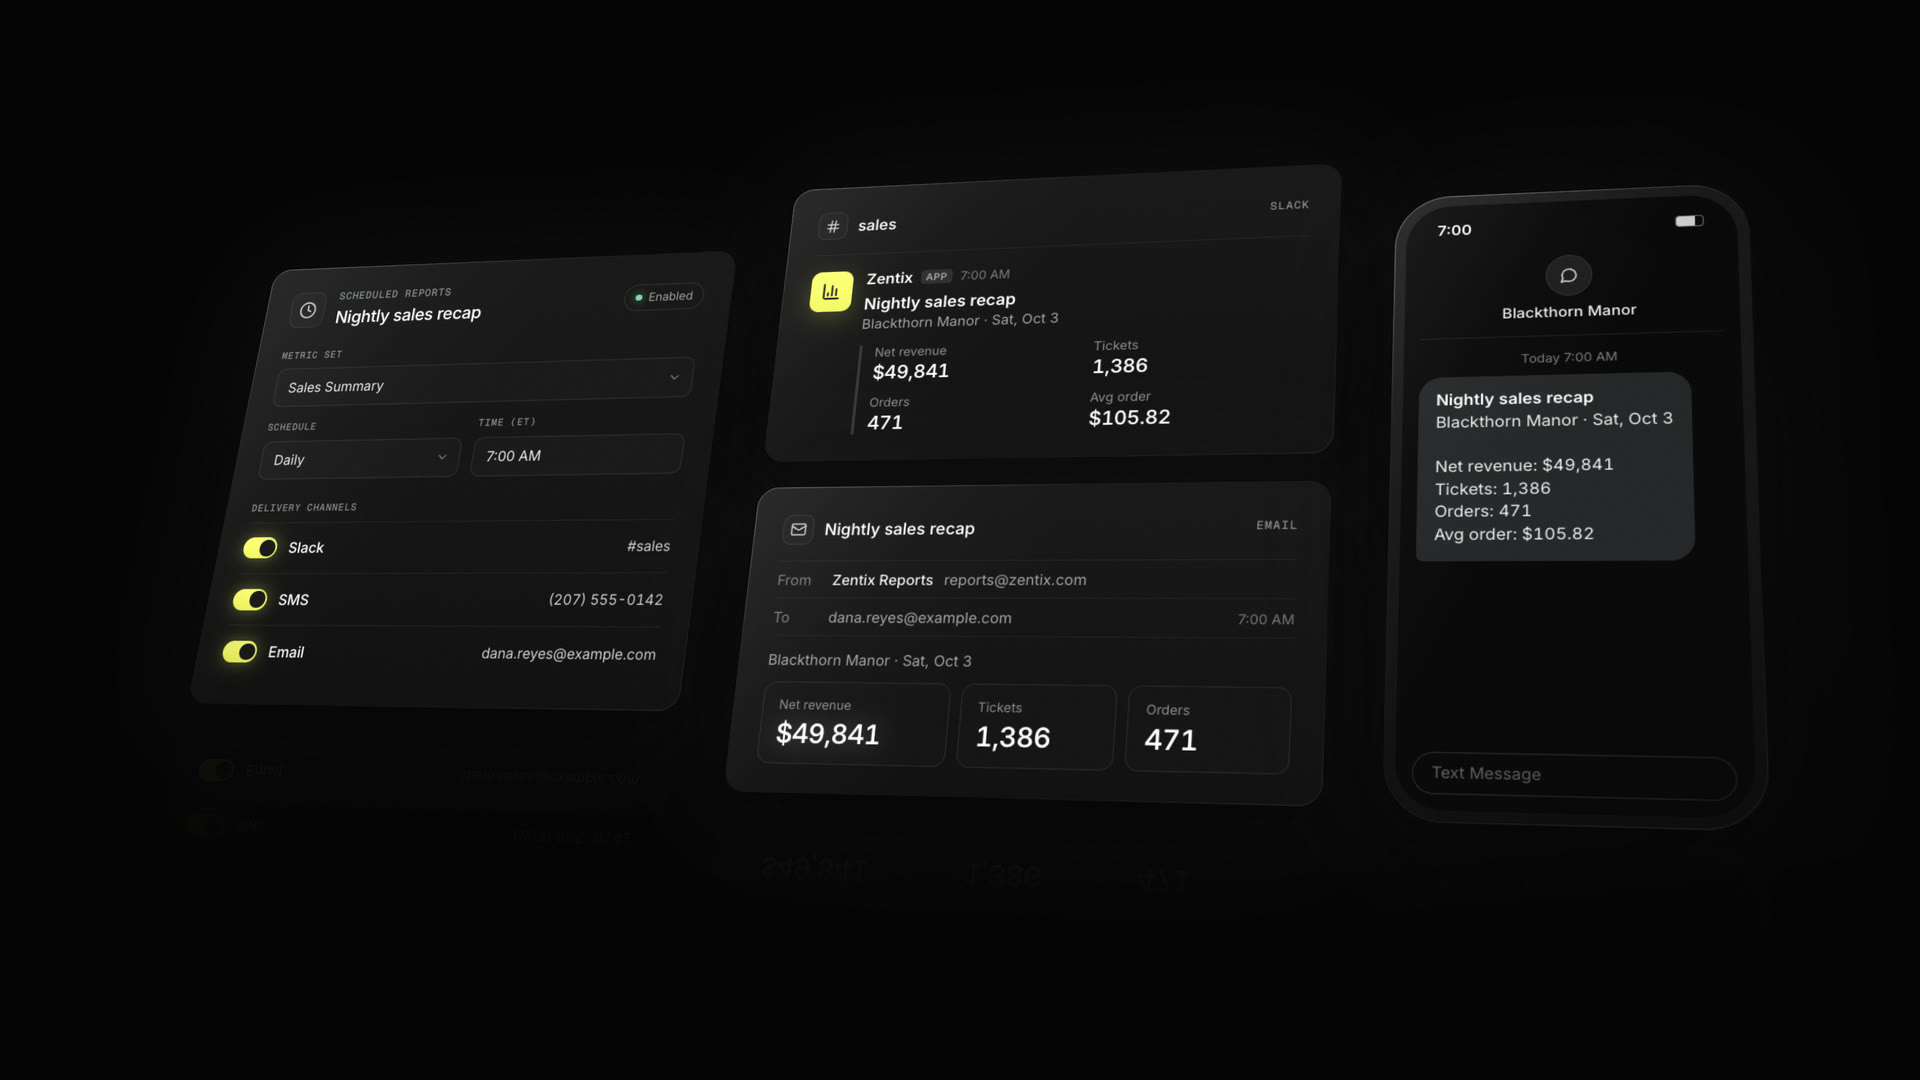
Schedule any report to Slack, email or SMS
Pick a report and a time, daily or on the weekdays you choose, and it arrives in a Slack channel, by email or as a text message. Scanned ticket counts can also send every hour while your sessions run.